Global Statistics and Country Indicators
PPP GDP per Capita by Country — G20 (2027)
GDP per capita adjusted for differences in price levels across countries. An international dollar has roughly the same purchasing power as $1 in the U.S.
Filter by:
Regions
Categories
Showing: 19 (0 territories)
High to low
2027
| 1 | United States | 100,208 | ||
| 2 | Germany | 82,158 | ||
| 3 | Saudi Arabia | 81,089 | ||
| 4 | Australia | 77,696 | ||
| 5 | South Korea | 74,628 | ||
| 6 | Canada | 73,830 | ||
| 7 | France | 71,342 | ||
| 8 | United Kingdom | 71,233 | ||
| 9 | Italy | 68,816 | ||
| 10 | Japan | 62,338 | ||
| 11 | Russia | 54,893 | ||
| 12 | Türkiye | 49,635 | ||
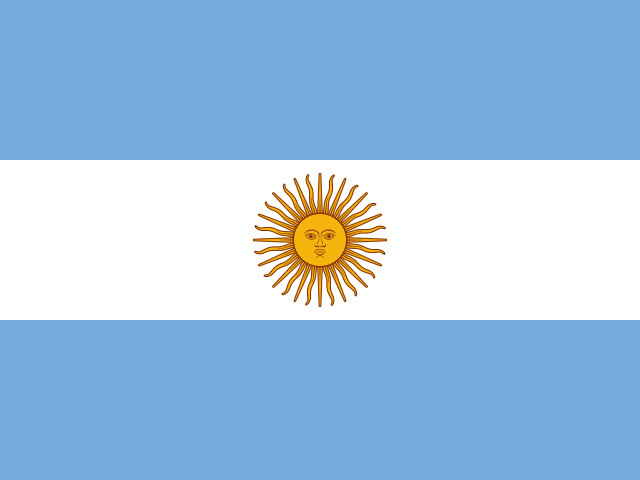
| 13 | Argentina | 34,761 | ||
| 14 | China | 34,178 | ||
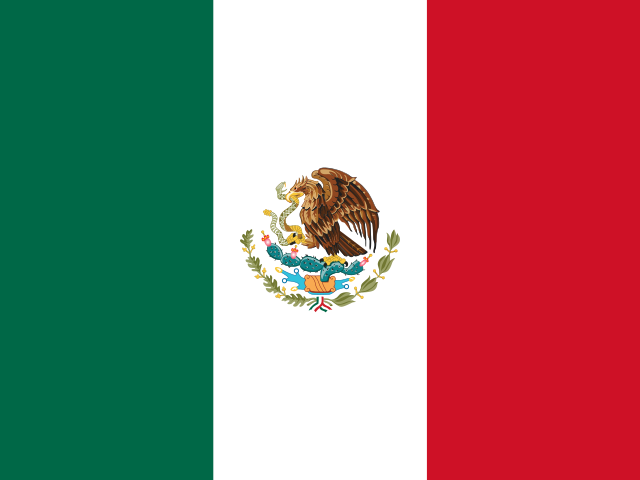
| 15 | Mexico | 27,863 | ||
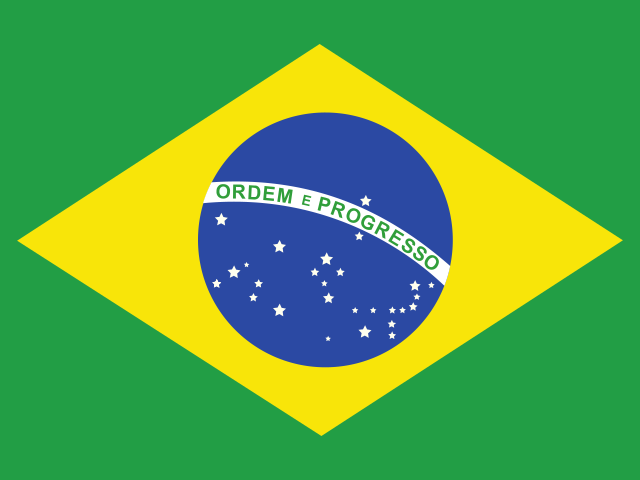
| 16 | Brazil | 25,759 | ||
| 17 | Indonesia | 20,506 | ||
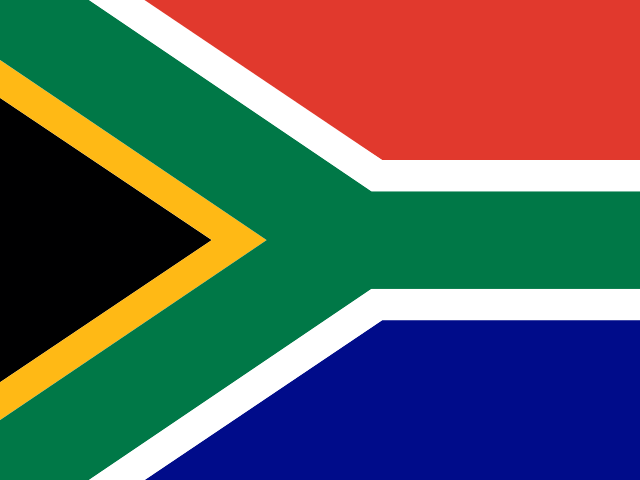
| 18 | South Africa | 17,392 | ||
| 19 | India | 14,226 |