Global Statistics and Country Indicators
PPP GDP per Capita by Country in North America (2027)
GDP per capita adjusted for differences in price levels across countries. An international dollar has roughly the same purchasing power as $1 in the U.S.
Filter by:
Regions
Categories
Showing: 24 (2 territories)
High to low
2027
| 1 | United States | 100,208 | ||
| 2 | Canada | 73,830 | ||
| 3 | Aruba | 62,767 | ||
| 4 | Puerto Rico | 56,198 | ||
| 5 | Panama | 50,046 | ||
| 6 | Bahamas | 49,169 | ||
| 7 | Trinidad and Tobago | 38,512 | ||
| 8 | Saint Kitts and Nevis | 37,083 | ||
| 9 | Costa Rica | 36,212 | ||
| 10 | Dominican Republic | 34,805 | ||
| 11 | Antigua and Barbuda | 34,428 | ||
| 12 | Saint Lucia | 30,857 | ||
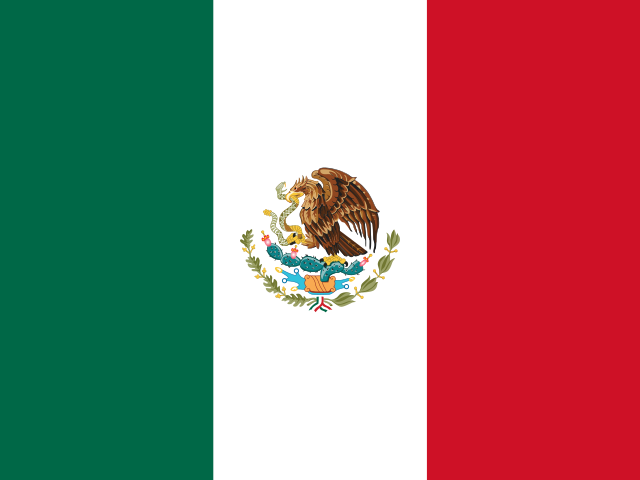
| 13 | Mexico | 27,863 | ||
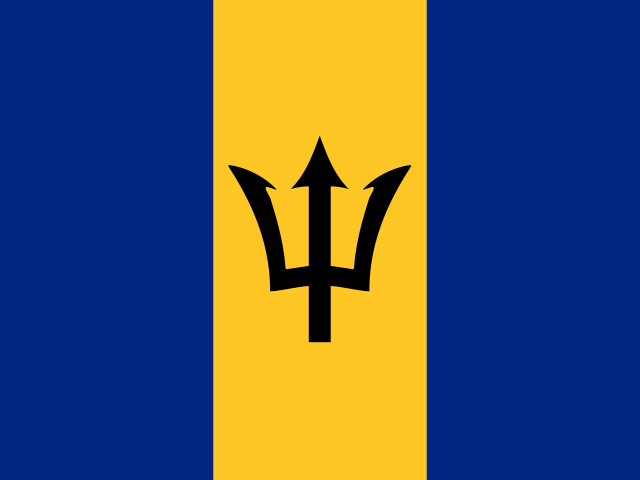
| 14 | Barbados | 27,695 | ||
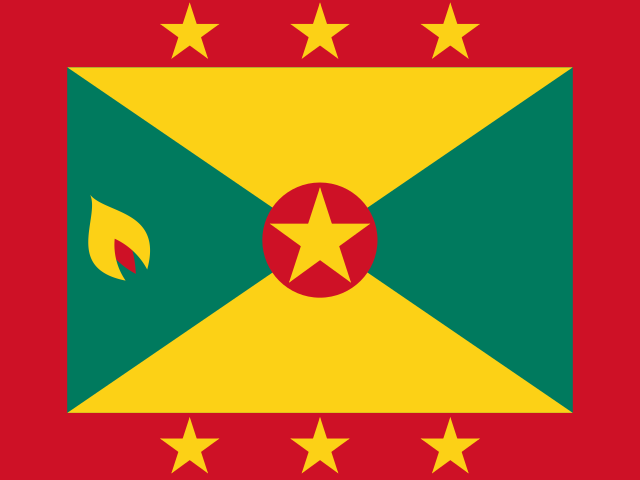
| 15 | Grenada | 24,588 | ||
| 16 | Saint Vincent and the Grenadines | 22,935 | ||
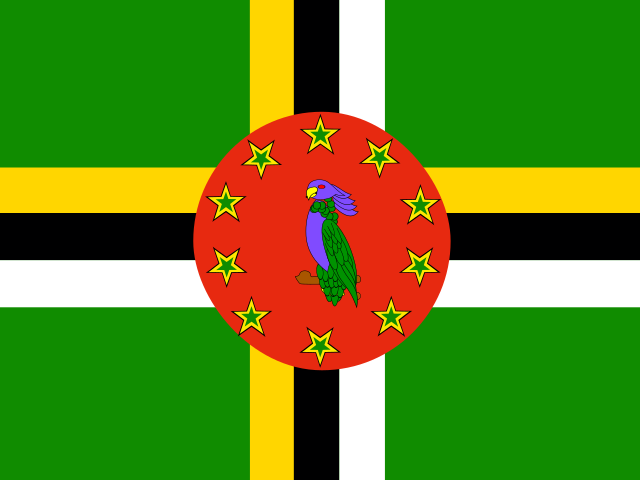
| 17 | Dominica | 21,841 | ||
| 18 | Guatemala | 17,004 | ||
| 19 | Belize | 16,173 | ||
| 20 | El Salvador | 16,061 | ||
| 21 | Jamaica | 14,922 | ||
| 22 | Nicaragua | 10,843 | ||
| 23 | Honduras | 8,681 | ||
| 24 | Haiti | 3,044 |