Global Statistics and Country Indicators
Services Imports by Country in Africa (2025)
Services imports. Converted to USD using each year’s exchange rate.
Filter by:
Regions
Categories
Showing: 48 (0 territories)
World Share: 2.5%
High to low
2025
| 1 | Egypt | 29.61B | ||
| 2 | South Africa | 21.77B | ||
| 3 | Nigeria | 19.64B | ||
| 4 | Morocco | 16.69B | ||
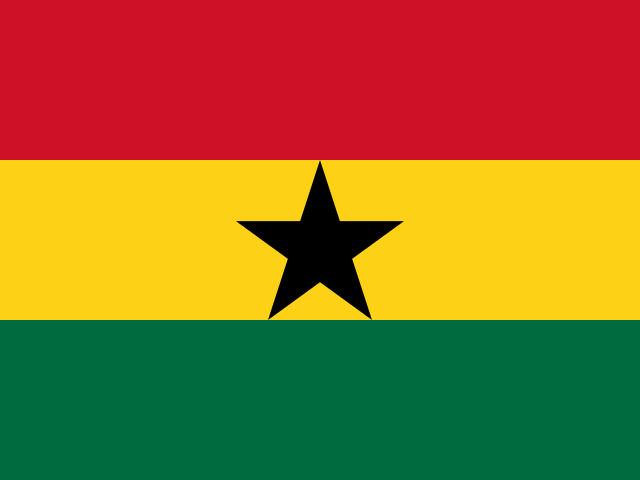
| 5 | Ghana | 14.64B | ||
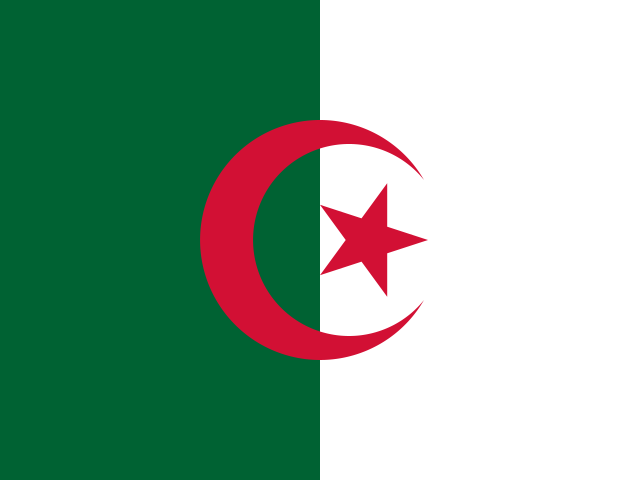
| 6 | Algeria | 11.02B | ||
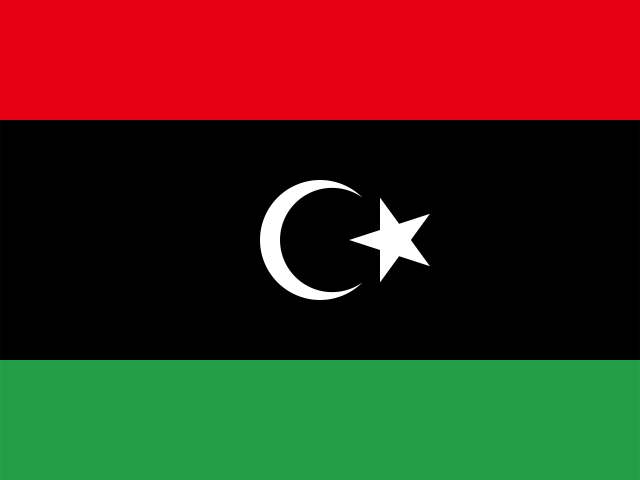
| 7 | Libya | 10.43B | ||
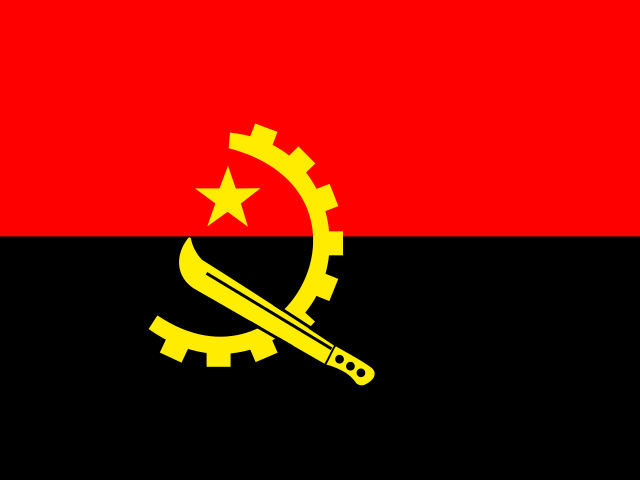
| 8 | Angola | 8.46B | ||
| 9 | Côte d’Ivoire | 7.55B | ||
| 10 | Kenya | 6.25B | ||
| 11 | Ethiopia | 5.9B | ||
| 12 | Uganda | 5.41B | ||
| 13 | DR Congo | 5.02B | ||
| 14 | Mauritius | 5.01B | ||
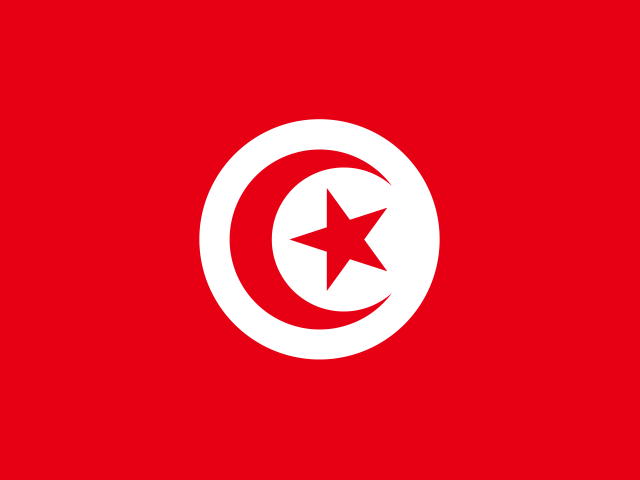
| 15 | Tunisia | 4.36B | ||
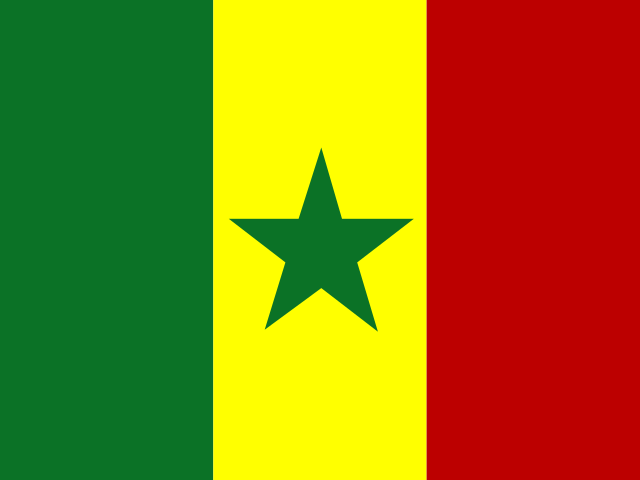
| 16 | Senegal | 3.47B | ||
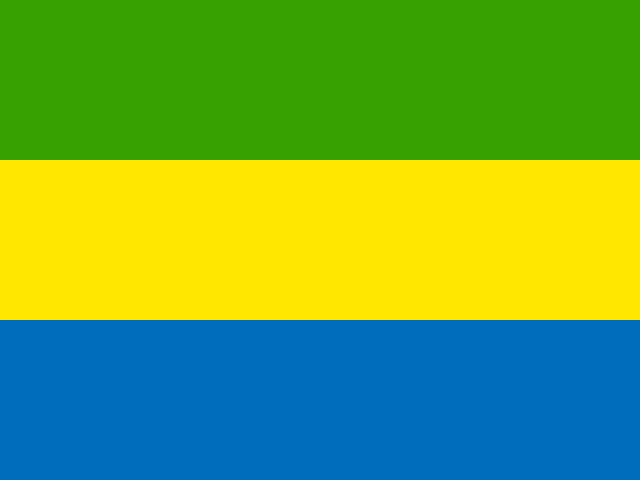
| 17 | Gabon | 3.39B | ||
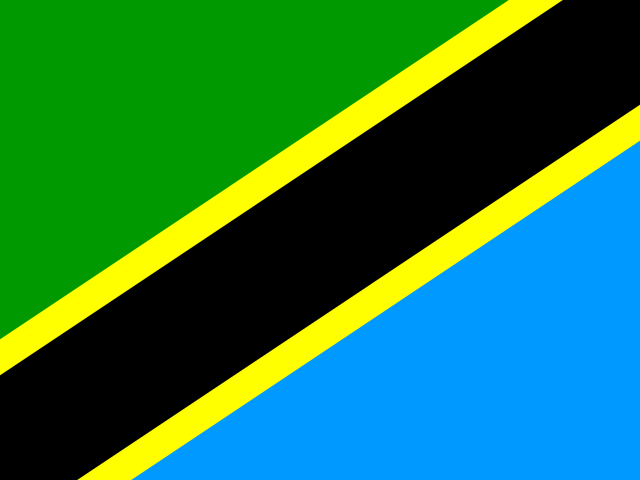
| 18 | Tanzania | 3.13B | ||
| 19 | Guinea | 3.06B | ||
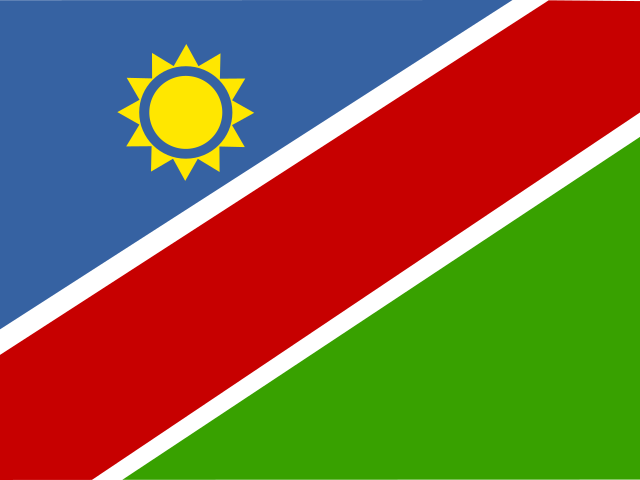
| 20 | Namibia | 2.68B | ||
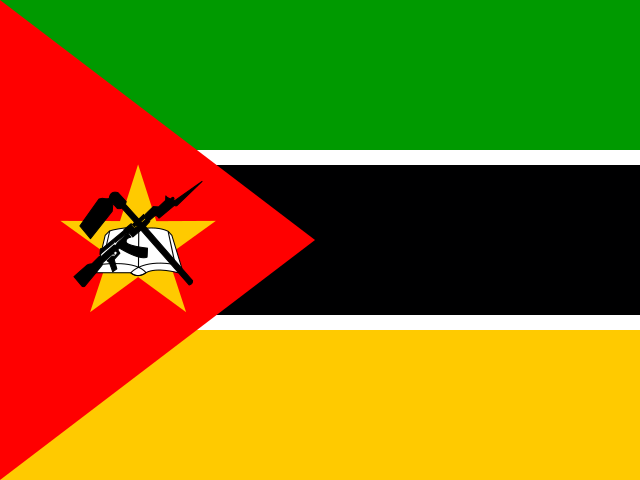
| 21 | Mozambique | 2.46B | ||
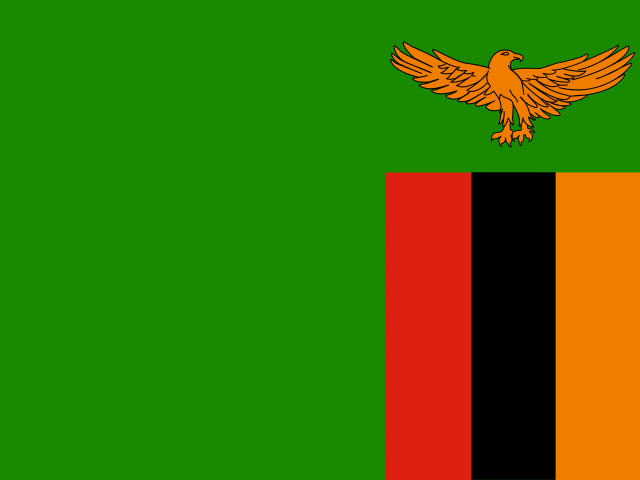
| 22 | Zambia | 2.2B | ||
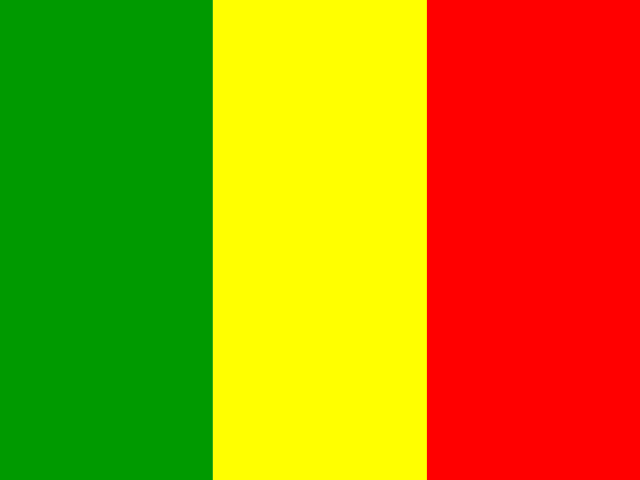
| 23 | Mali | 2.12B | ||
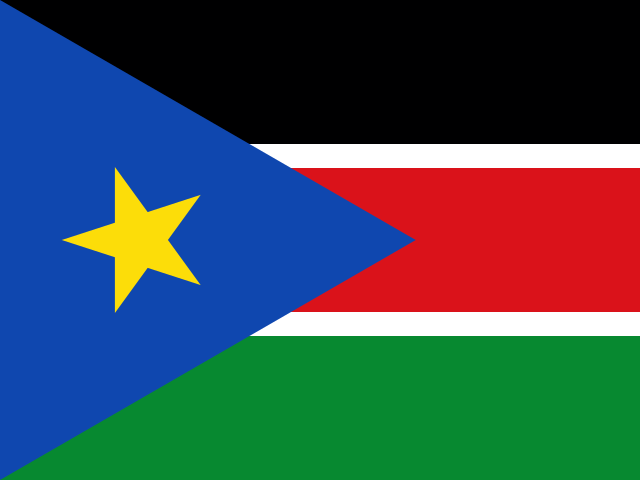
| 24 | South Sudan | 1.82B | ||
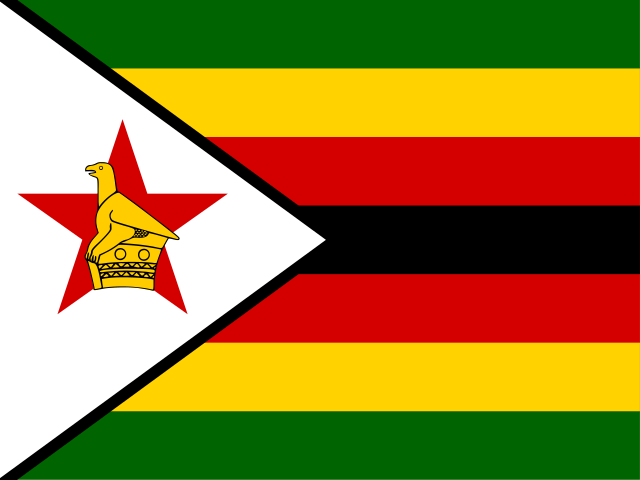
| 25 | Zimbabwe | 1.82B | ||
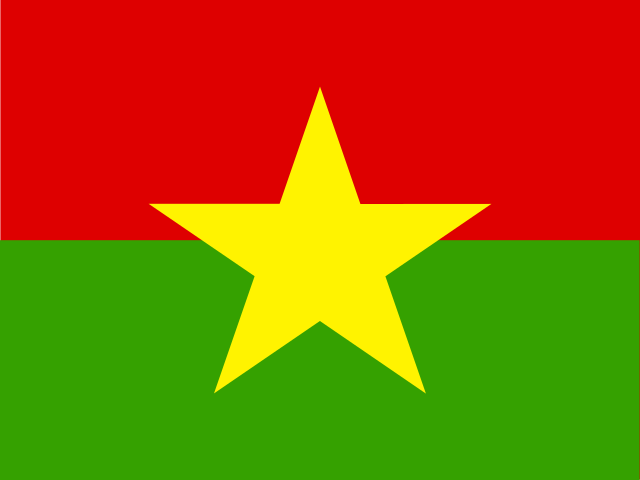
| 26 | Burkina Faso | 1.72B | ||
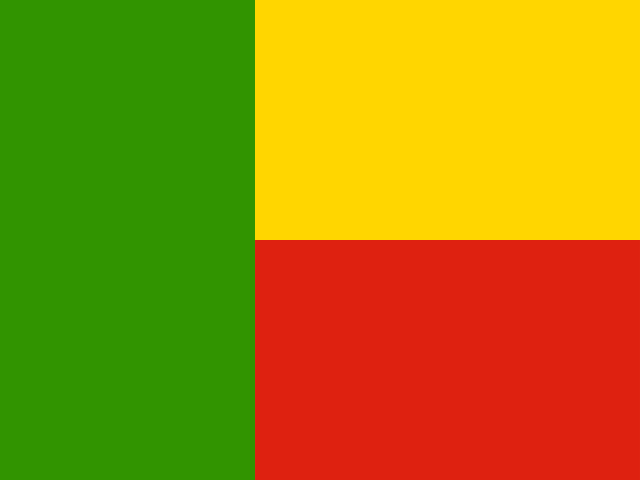
| 27 | Benin | 1.56B | ||
| 28 | Niger | 1.52B | ||
| 29 | Madagascar | 1.4B | ||
| 30 | Botswana | 1.32B | ||
| 31 | Chad | 1.29B | ||
| 32 | Seychelles | 1.08B | ||
| 33 | Mauritania | 1.04B | ||
| 34 | Rwanda | 1B | ||
| 35 | Malawi | 953.2M | ||
| 36 | Sudan | 856.8M | ||
| 37 | Djibouti | 736.9M | ||
| 38 | Togo | 695.8M | ||
| 39 | Sierra Leone | 521.1M | ||
| 40 | Eswatini | 469.7M | ||
| 41 | Lesotho | 467.2M | ||
| 42 | Burundi | 406.3M | ||
| 43 | Cabo Verde | 349.3M | ||
| 44 | Liberia | 248.2M | ||
| 45 | Comoros | 228.5M | ||
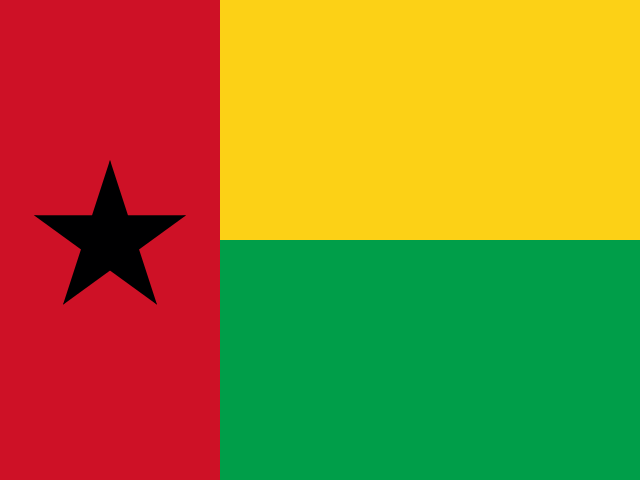
| 46 | Guinea-Bissau | 222.9M | ||
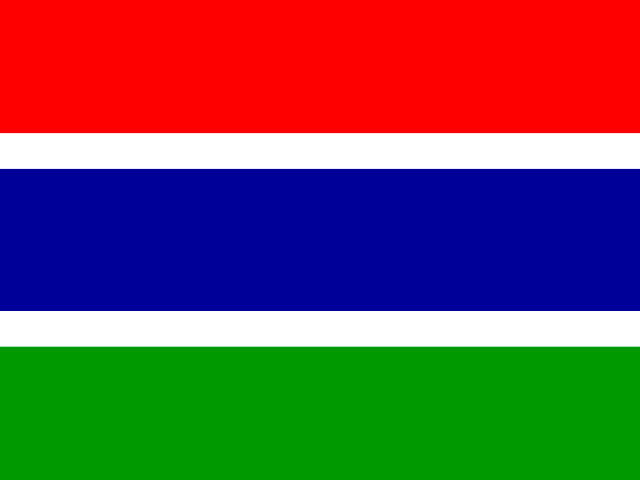
| 47 | Gambia | 184.2M | ||
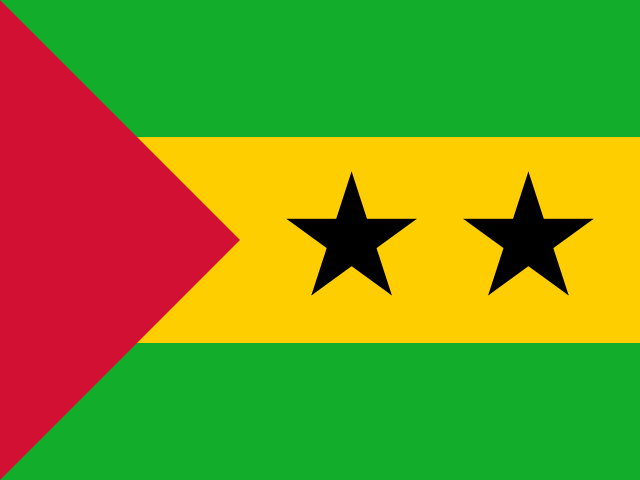
| 48 | São Tomé and Príncipe | 149M |