Global Statistics and Country Indicators
GDP by Country in Africa (2027)
The total value added by goods and services produced within the country. Converted to USD using each year’s exchange rate.
Filter by:
Regions
Categories
Showing: 52 (0 territories)
World Share: 2.9%
High to low
2027
| 1 | South Africa | 517.6B | ||
| 2 | Egypt | 486.2B | ||
| 3 | Nigeria | 467.9B | ||
| 4 | Algeria | 338.9B | ||
| 5 | Morocco | 207.6B | ||
| 6 | Angola | 170B | ||
| 7 | Kenya | 162.3B | ||
| 8 | Ethiopia | 145.7B | ||
| 9 | Ghana | 131.6B | ||
| 10 | DR Congo | 130.7B | ||
| 11 | Côte d’Ivoire | 119.5B | ||
| 12 | Tanzania | 104B | ||
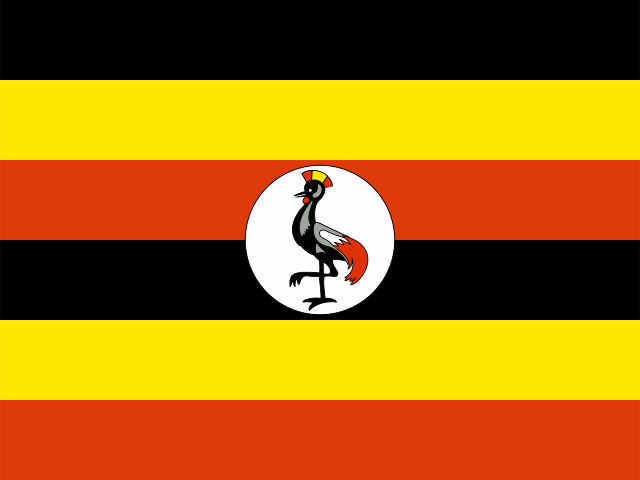
| 13 | Uganda | 80.41B | ||
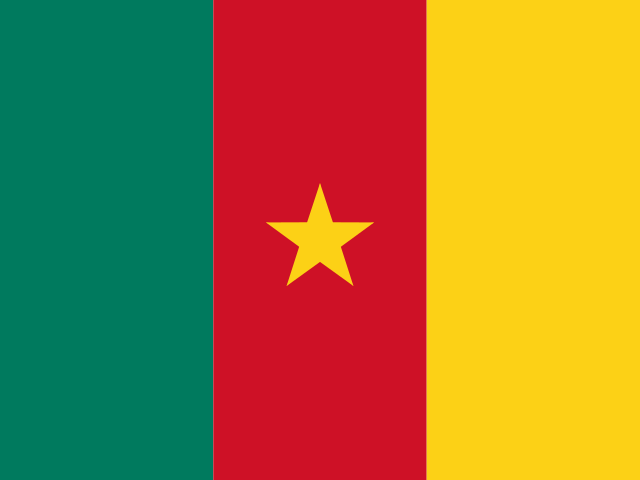
| 14 | Cameroon | 69.49B | ||
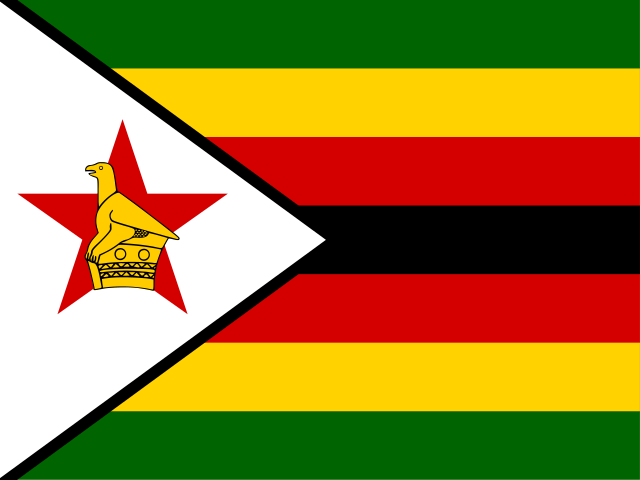
| 15 | Zimbabwe | 69.31B | ||
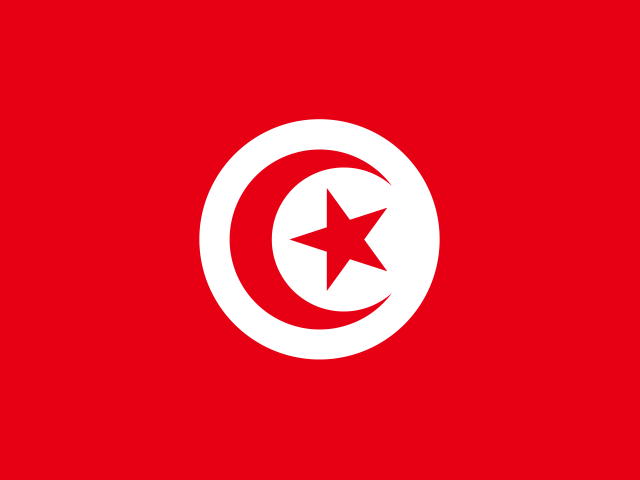
| 16 | Tunisia | 62.85B | ||
| 17 | Libya | 55.75B | ||
| 18 | Guinea | 49.99B | ||
| 19 | Zambia | 45.58B | ||
| 20 | Mali | 37.76B | ||
| 21 | Burkina Faso | 34.7B | ||
| 22 | Benin | 29.82B | ||
| 23 | Sudan | 27.18B | ||
| 24 | Chad | 26.93B | ||
| 25 | Gabon | 26.35B | ||
| 26 | Mozambique | 26.19B | ||
| 27 | Niger | 25.36B | ||
| 28 | Botswana | 23.7B | ||
| 29 | Madagascar | 22.72B | ||
| 30 | Rwanda | 20.17B | ||
| 31 | Malawi | 20B | ||
| 32 | Namibia | 19.5B | ||
| 33 | Republic of the Congo | 18.96B | ||
| 34 | Mauritius | 18.16B | ||
| 35 | Somalia | 16.02B | ||
| 36 | Mauritania | 14.79B | ||
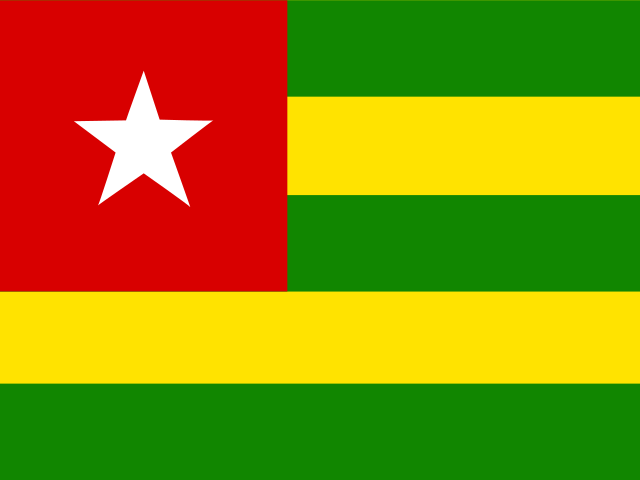
| 37 | Togo | 14.13B | ||
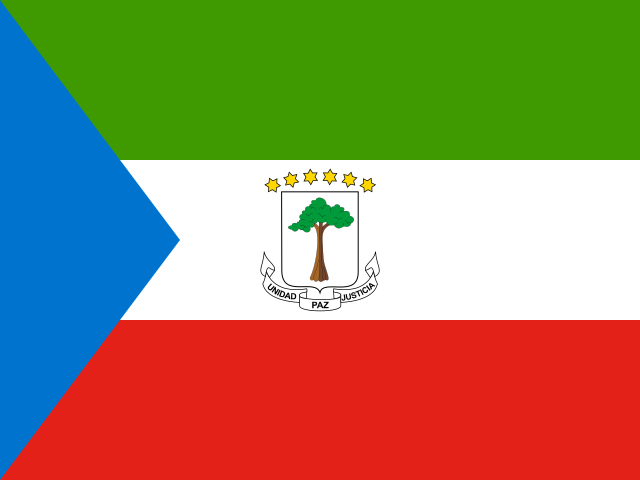
| 38 | Equatorial Guinea | 13.81B | ||
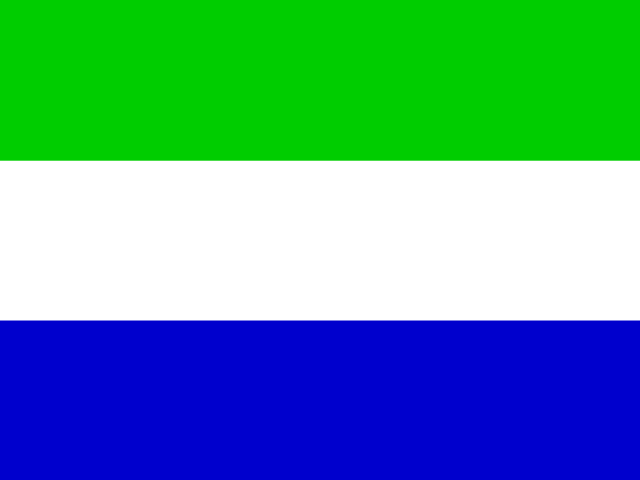
| 39 | Sierra Leone | 8.84B | ||
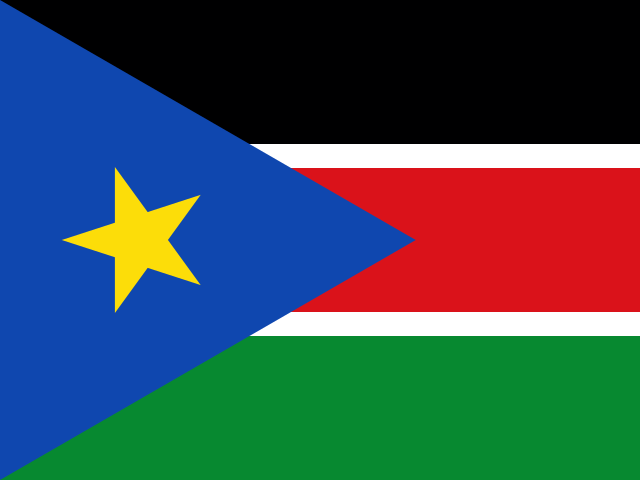
| 40 | South Sudan | 8.67B | ||
| 41 | Burundi | 8.46B | ||
| 42 | Eswatini | 6.42B | ||
| 43 | Liberia | 6.12B | ||
| 44 | Central African Republic | 5.41B | ||
| 45 | Djibouti | 5.24B | ||
| 46 | Cabo Verde | 3.65B | ||
| 47 | Gambia | 3.26B | ||
| 48 | Lesotho | 3.22B | ||
| 49 | Guinea-Bissau | 3.17B | ||
| 50 | Seychelles | 2.49B | ||
| 51 | Comoros | 1.83B | ||
| 52 | São Tomé and Príncipe | 1.25B |