Global Statistics and Country Indicators
Trade Balance by Country in Oceania (2025)
Exports minus goods imports. Excludes services. Converted to USD using each year’s exchange rate.
Filter by:
Regions
Categories
Showing: 23 (7 territories)
High to low
2025
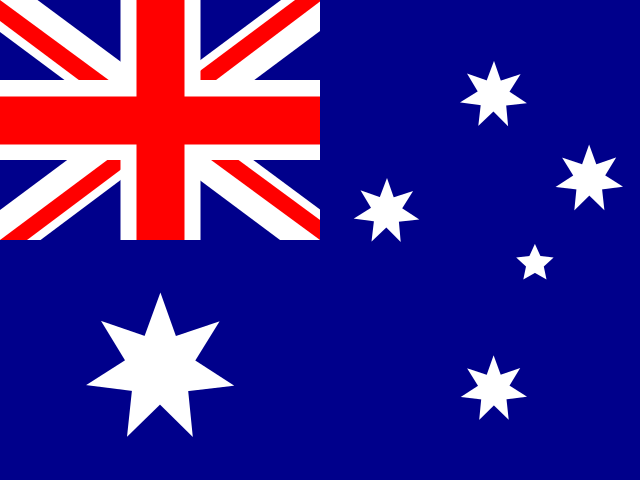
| 1 | Australia | 27.48B | ||
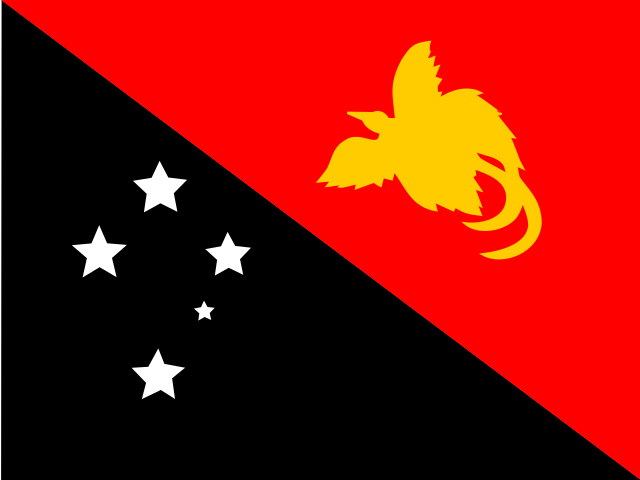
| 2 | Papua New Guinea | 10.74B | ||
| 3 | Tokelau | 0.17M | ||
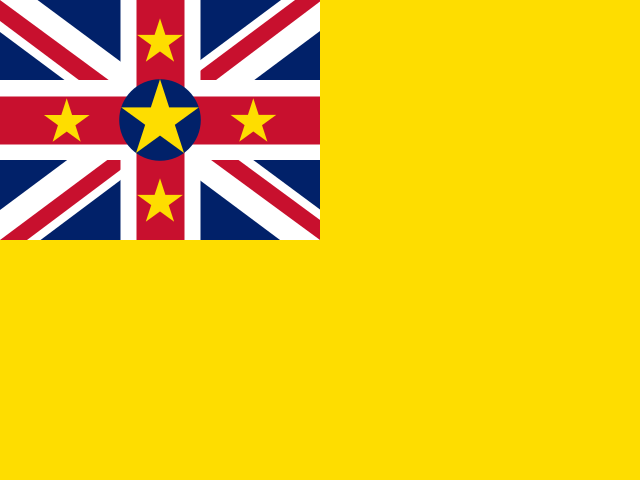
| 4 | Niue | -24.78M | ||
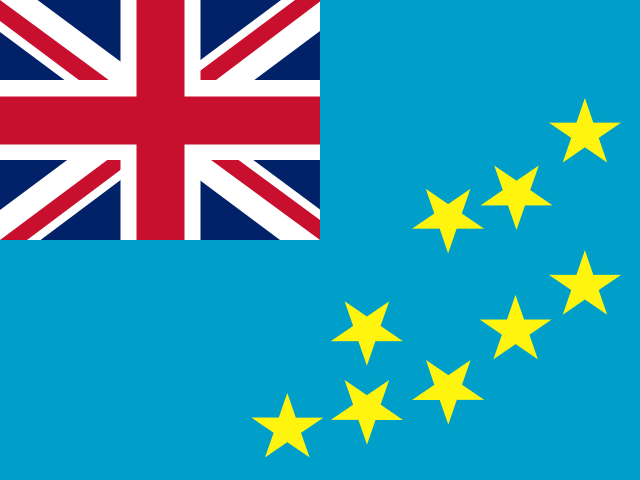
| 5 | Tuvalu | -26.42M | ||
| 6 | Marshall Islands | -37.86M | ||
| 7 | Nauru | -41.61M | ||
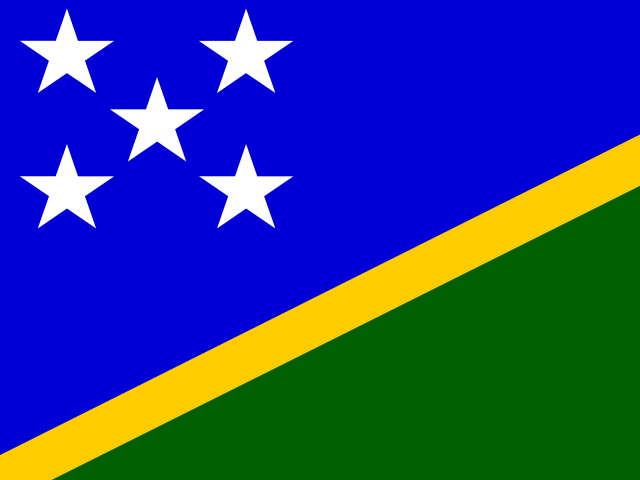
| 8 | Solomon Islands | -62.04M | ||
| 9 | Wallis and Futuna | -86.8M | ||
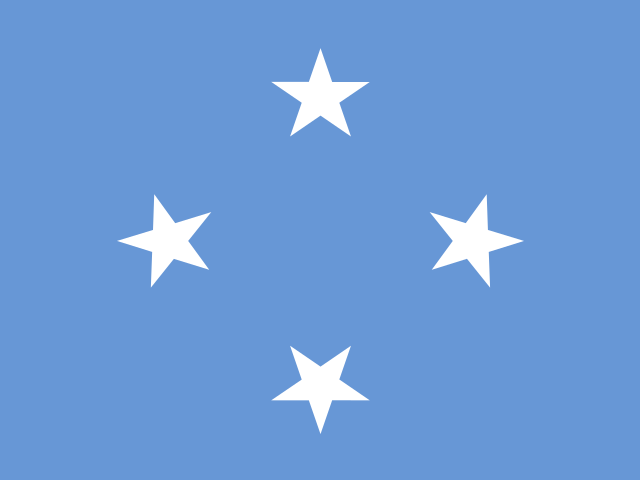
| 10 | Federated States of Micronesia | -94M | ||
| 11 | Palau | -159.1M | ||
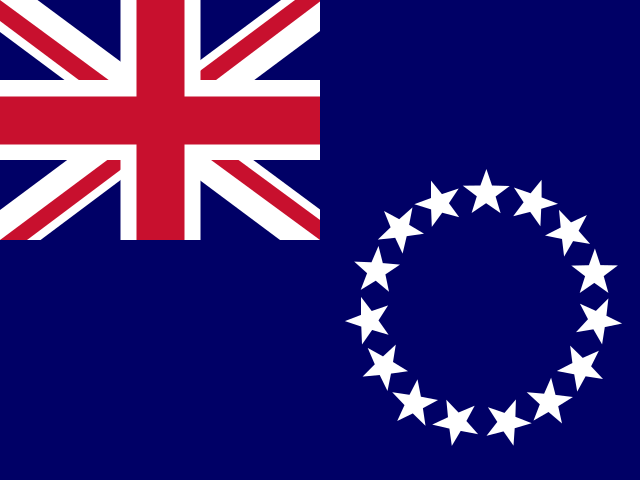
| 12 | Cook Islands | -199.5M | ||
| 13 | American Samoa | -263.6M | ||
| 14 | Tonga | -296.3M | ||
| 15 | Vanuatu | -309.7M | ||
| 16 | Kiribati | -382.3M | ||
| 17 | Samoa | -454.4M | ||
| 18 | Northern Mariana Islands | -505.5M | ||
| 19 | New Caledonia | -833.8M | ||
| 20 | Guam | -877.4M | ||
| 21 | New Zealand | -959.8M | ||
| 22 | Fiji | -2.11B | ||
| 23 | French Polynesia | -2.11B |