Global Statistics and Country Indicators
FDI Outflows (% of GDP) by Country in Oceania (2024)
Foreign direct investment made abroad minus disinvestment, as a share of GDP.
Filter by:
Regions
Categories
Showing: 12 (2 territories)
High to low
2024
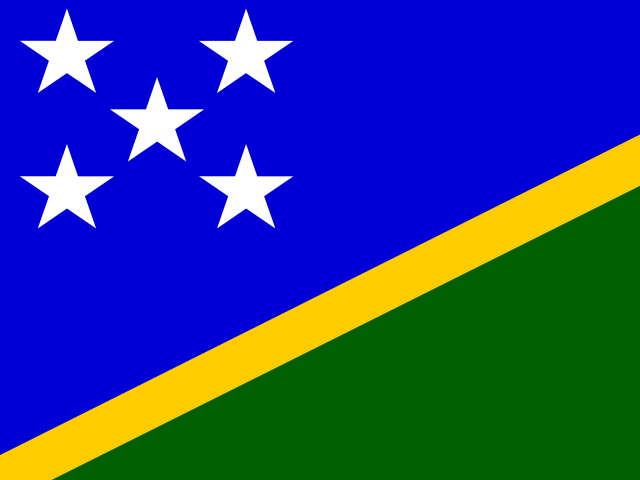
| 1 | Solomon Islands | 3.3% | ||
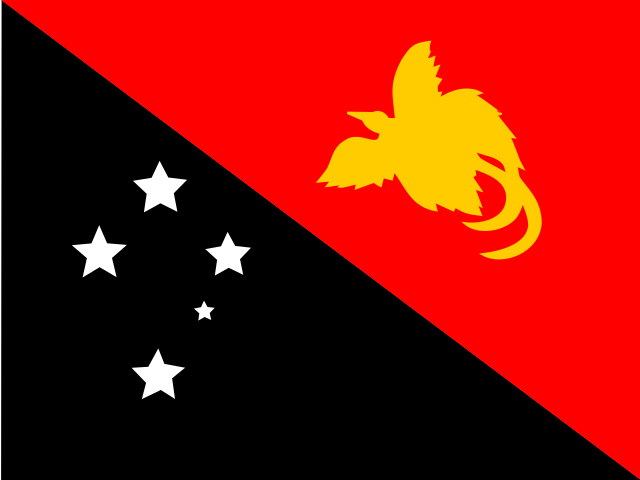
| 2 | Papua New Guinea | 2.5% | ||
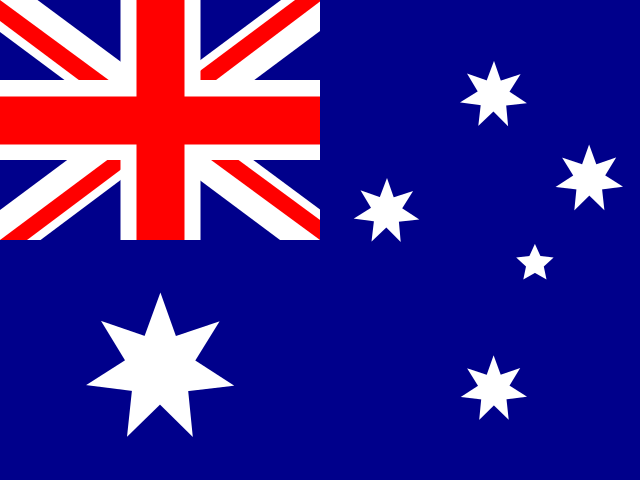
| 3 | Australia | 0.8% | ||
| 4 | New Caledonia | 0.5% | ||
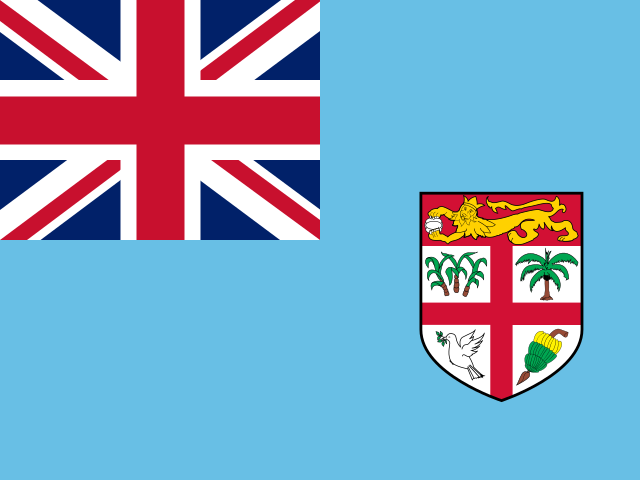
| 5 | Fiji | 0.4% | ||
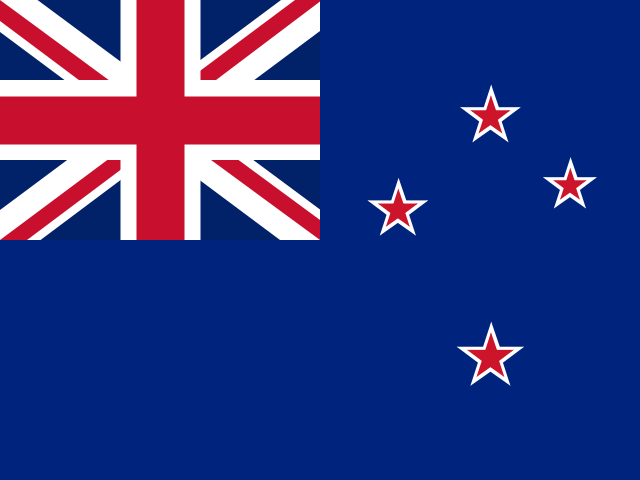
| 6 | New Zealand | 0.3% | ||
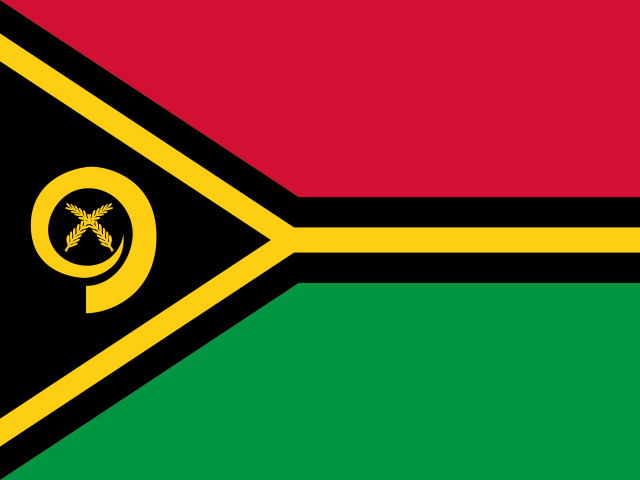
| 7 | Vanuatu | 0.2% | ||
| 8 | Tonga | 0.2% | ||
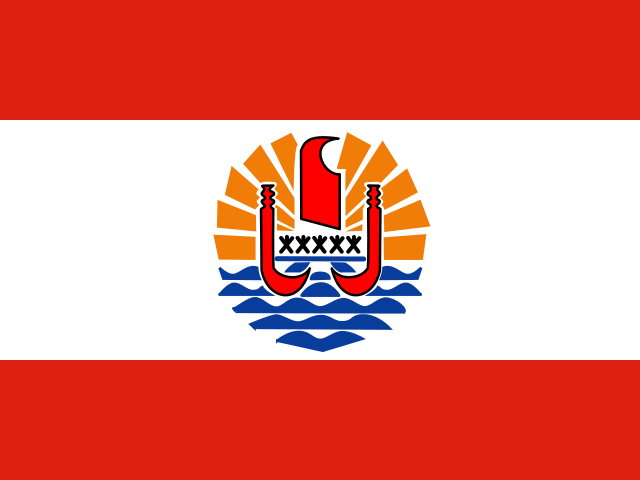
| 9 | French Polynesia | 0.2% | ||
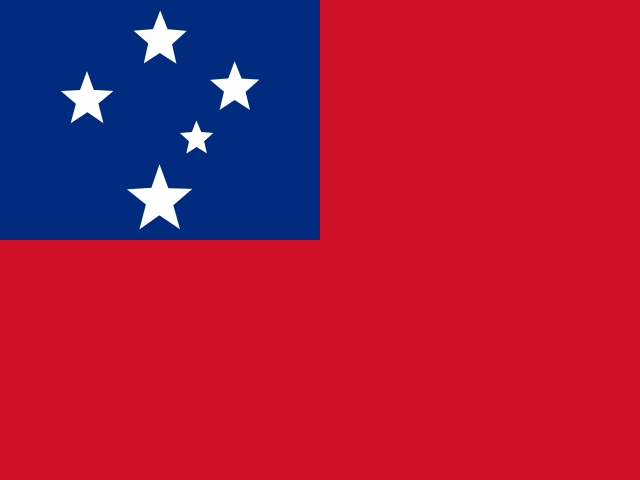
| 10 | Samoa | 0.2% | ||
| 11 | Kiribati | 0% | ||
| 12 | Nauru | -0.8% |